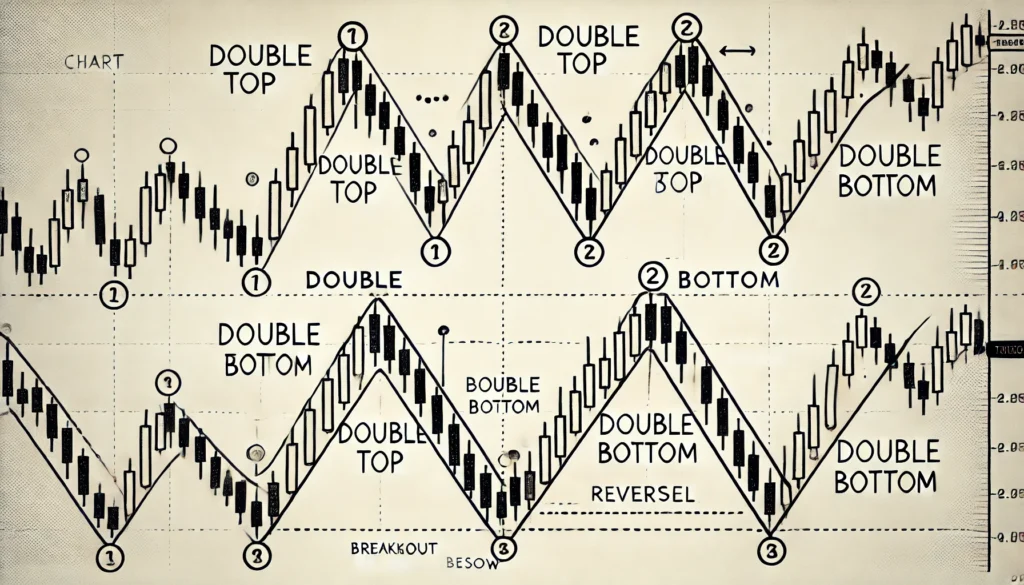
Double Top Pattern
Overview:A double top is a bearish reversal pattern that forms after an extended uptrend. It signals a potential trend reversal when the price reaches a high point twice but fails to break through, indicating strong resistance. This pattern resembles the letter ‘M.’
Formation:
Price rallies to a peak and retraces.
It rises again to a similar level, forming two peaks at approximately the same height.
A neckline forms at the lowest point between the two peaks.
A confirmed breakdown below the neckline completes the pattern, indicating a bearish trend.
Trading Strategy:
Entry Point: Enter a short position when the price breaks below the neckline with significant volume.
Stop Loss: Place the stop loss slightly above the second peak. This level acts as a strong resistance.
Profit Target: Measure the height from the peaks to the neckline and subtract this distance from the breakout point to estimate the potential downside target.
Example Calculation:
Peak price: $100
Neckline: $90
Distance from peak to neckline: $10
Breakout target: $90 – $10 = $80
Fake Breakout in Double Top:
A fake breakout can occur if the price breaks below the neckline but quickly reverses to move higher.
To Avoid Traps: Wait for a retest of the neckline after the breakout. Enter the trade only if the price fails to reclaim the neckline level.
Double Bottom Pattern
Overview:A double bottom is a bullish reversal pattern that forms after a prolonged downtrend. It signals a potential trend reversal when the price drops to a low point twice but fails to break lower, indicating strong support. This pattern resembles the letter ‘W.’
Formation:
Price declines to a trough and rebounds.
It falls again to a similar level, forming two troughs at approximately the same depth.
A neckline forms at the highest point between the two troughs.
A confirmed breakout above the neckline signals a bullish trend.
Trading Strategy:
Entry Point: Enter a long position when the price breaks above the neckline with increased volume.
Stop Loss: Place the stop loss slightly below the second trough. This area acts as a strong support.
Profit Target: Measure the height from the troughs to the neckline and add this distance to the breakout point to estimate the potential upside target.
Example Calculation:
Trough price: $50
Neckline: $60
Distance from trough to neckline: $10
Breakout target: $60 + $10 = $70
Fake Breakout in Double Bottom:
A fake breakout occurs if the price breaks above the neckline but quickly falls back below it.
To Avoid Traps: Wait for a retest of the neckline after the breakout. Enter the trade only if the price holds above the neckline.
Key Tips for Trading These Patterns:
Always confirm breakouts with volume. A significant volume increase during the breakout adds credibility to the pattern.
Consider market conditions. These patterns work best in volatile or trending markets.
Combine patterns with other indicators like RSI, MACD, or moving averages to enhance accuracy.